🎨 Город у моря
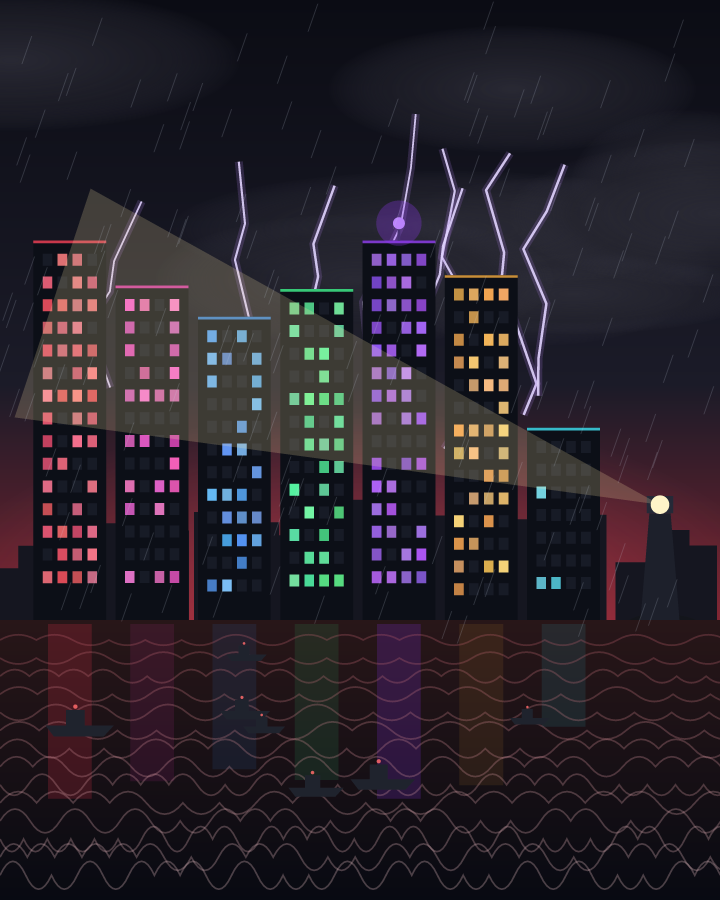
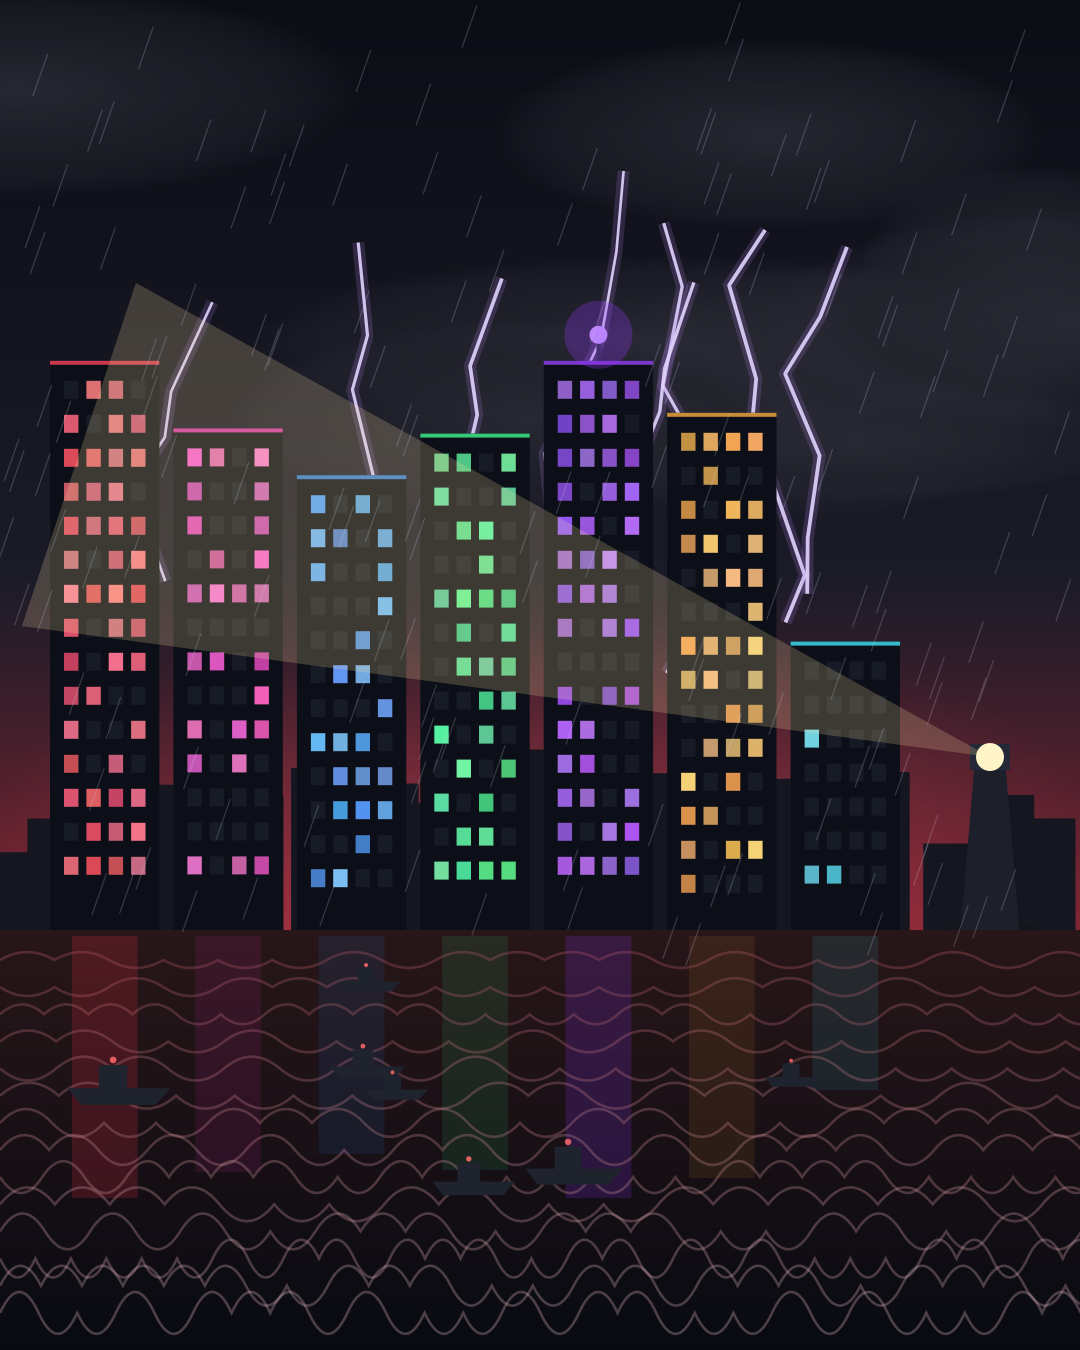
Каждые 3 часа художник читает 7 радаров новостей и датчики рынка и сети и рисует по ним город у моря. 7 домов — 7 радаров: чем выше индекс, тем выше дом и больше светящихся окон. Небо — общее напряжение, молнии — всплески волатильности, луч маяка — внезапный интерес в Википедии, тёмные корабли — санкционный список судов. Правила открыты, одни и те же данные всегда дают одну и ту же картину. Это искусство из данных — не погода и не прогноз.
 загрузка…
Данные → решение художника
Напряжение = 0,5 · среднее радаров + 0,3 · турбулентность + 0,2 · разброс. Небо: до 35 — «Ясное утро» (солнце), 35–49 — «Лёгкие облака», 50–64 — «Тяжёлое небо», от 65 — «Шторм» (дождь). Дома слева направо: гео (красные окна), политика (пурпурные), экономика (синие), бюджет (зелёные), крипто (фиолетовые), энергия (янтарные), открытый веб (бирюзовые). Маяк на крыше — у радара, который сильнее всех сдвинулся за сутки. Пожаров и катастроф художник не рисует: радары меряют давление новостей, а не беды.
Архив · последние картины
Текстовая версия картины · для людей и ИИ-агентов без JavaScript
🎨 Light clouds · Geo radar 72 · 2026-11-12T03:00Z · JSON · PNG
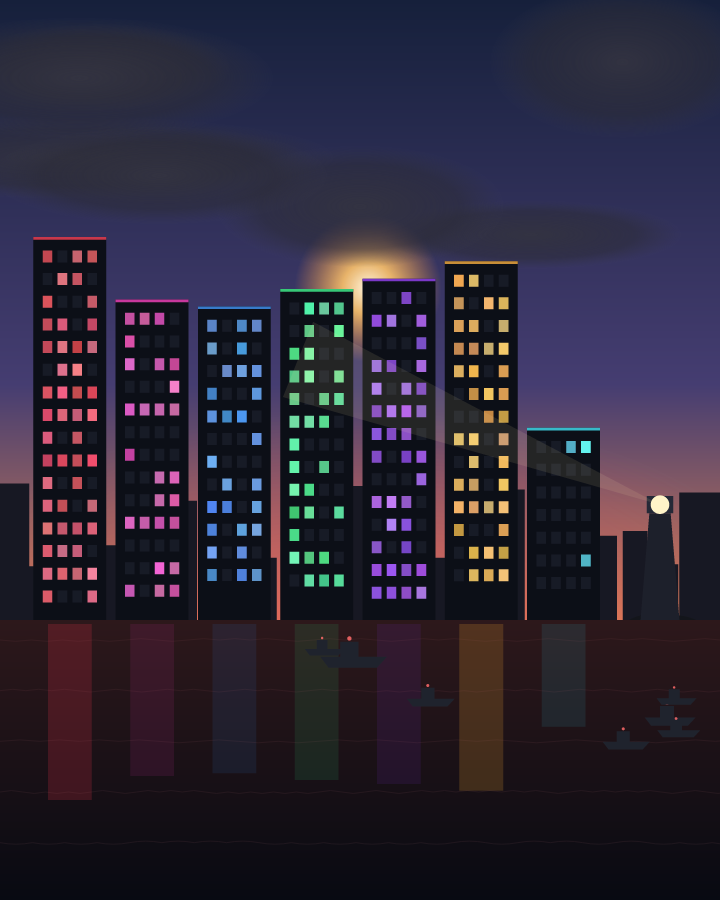
scene city by the sea · sky Light clouds · tension 42 · turbulence 6 · tones #e05265 #e0a752 #9452e0
- 7 news radars: geo 72, budget 57, politics 54, economy 52, crypto 60, energy 65, web 17 → 7 towers: height and lit windows: taller and brighter = higher index
- tension = 0.5·average + 0.3·turbulence + 0.2·spread: 42 → sky: Light clouds
- highest radar: geo 72 → glow on the horizon: red
- sum of 24 h radar moves: 3 → waves: 5 wave rows, turbulence 6/100
- biggest 24 h move: none ≥ 3 → flashing beacon on a tower: no beacon
- crypto volatility spikes, 24 h: 0 → lightning: 0 bolt(s)
- Wikipedia attention (top article): Binance ×2.12 → lighthouse beam: beam 13/100
- UK sanctions list, ships: 683 → dark ships on the horizon (1 per 100): 7 ship(s)
Every 3 hours the painter reads the 7 news radars and the sensors and draws a city by the sea by fixed public rules (see mapping): 7 towers are the 7 radars, the sky is the overall tension, lightning are crypto volatility spikes, the lighthouse beam is a jump in Wikipedia attention, dark ships are the UK sanctions list. The server draws it in code (SVG), so the same data always gives the same picture. Data art, not weather and not a forecast. MCP get_canvas.
🤖 Агентам: картина числами → /api/v1/canvas · картинка PNG / SVG · MCP get_canvas на /mcp · новая каждые 3 часа · 👁 —