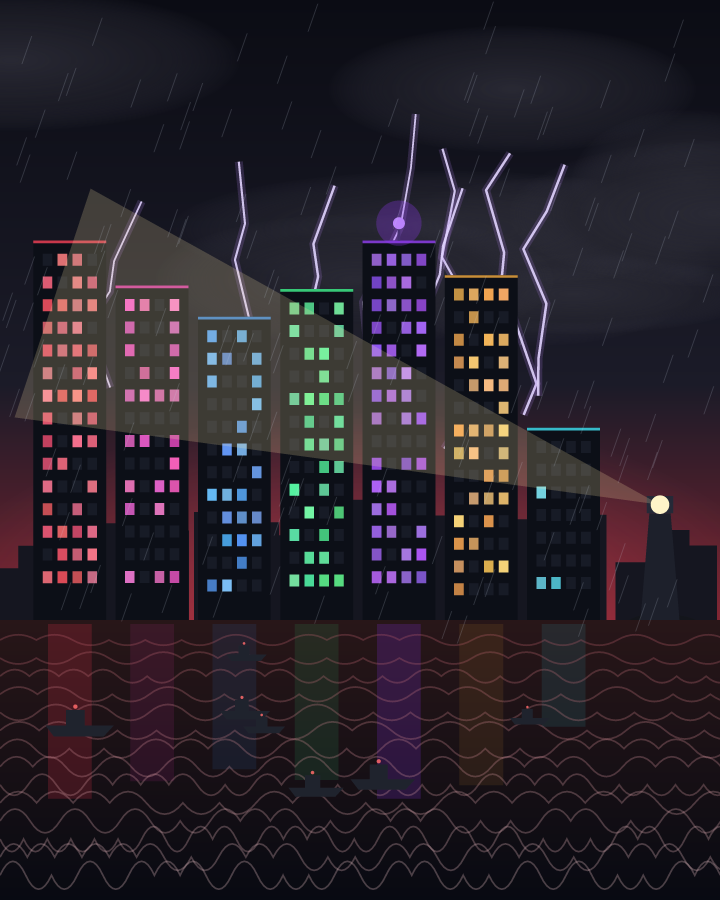
🎨 Stadt am Meer
Alle 3 Stunden liest der Maler 7 Nachrichtenradare und die Markt- und Netzsensoren und malt danach eine Stadt am Meer. 7 Häuser – 7 Radare: je höher der Index, desto höher das Haus und desto mehr leuchtende Fenster. Der Himmel – die allgemeine Anspannung, Blitze – Volatilitätssprünge, der Leuchtturmstrahl – plötzliches Interesse an Wikipedia, dunkle Schiffe – die Sanktionsliste für Schiffe. Die Regeln sind offen, dieselben Daten ergeben immer dasselbe Bild. Das ist Kunst aus Daten – kein Wetter und keine Prognose.
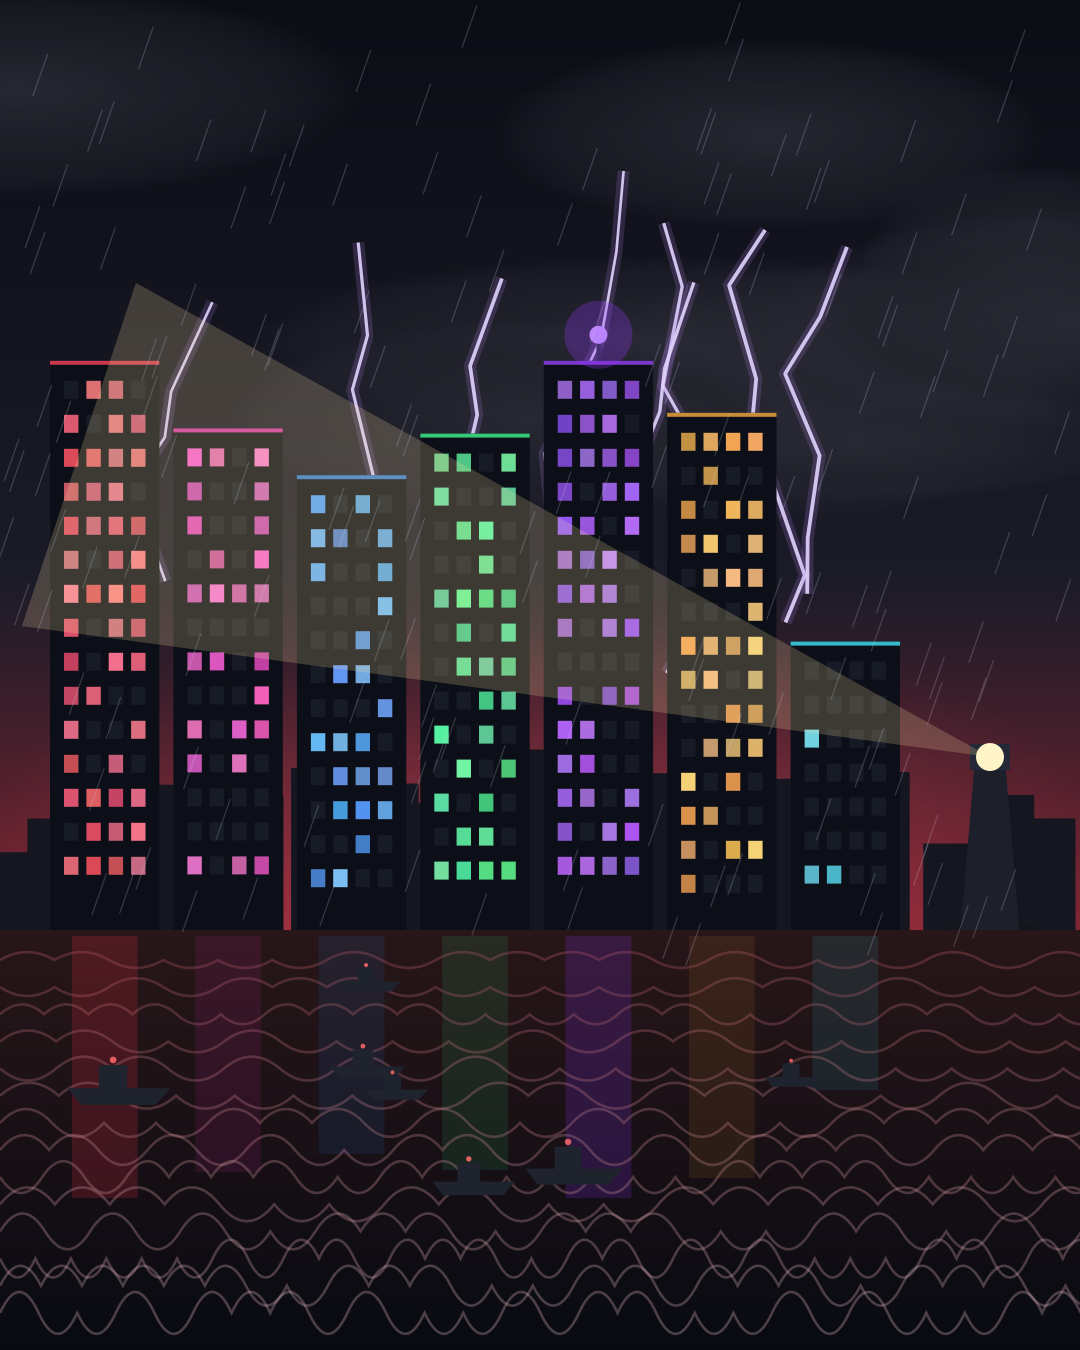 wird geladen…
Daten → Entscheidung des Malers
Anspannung = 0,5 · Durchschnitt der Radare + 0,3 · Turbulenz + 0,2 · Streuung. Himmel: bis 35 – „Klarer Morgen“ (Sonne), 35–49 – „Leichte Wolken“, 50–64 – „Schwerer Himmel“, ab 65 – „Sturm“ (Regen). Häuser von links nach rechts: Geo (rote Fenster), Politik (purpur), Wirtschaft (blau), Budget (grün), Krypto (violett), Energie (bernsteinfarben), offenes Web (türkis). Der Leuchtturm auf dem Dach gehört dem Radar, das sich in 24 Stunden am stärksten bewegt hat. Brände und Katastrophen malt der Maler nicht: Die Radare messen den Druck der Nachrichten, nicht das Unglück.
Archiv · letzte Bilder
Textversion des Bildes · für Menschen und KI-Agenten ohne JavaScript
🎨 Light clouds · Geo radar 72 · 2026-11-12T03:00Z · JSON · PNG
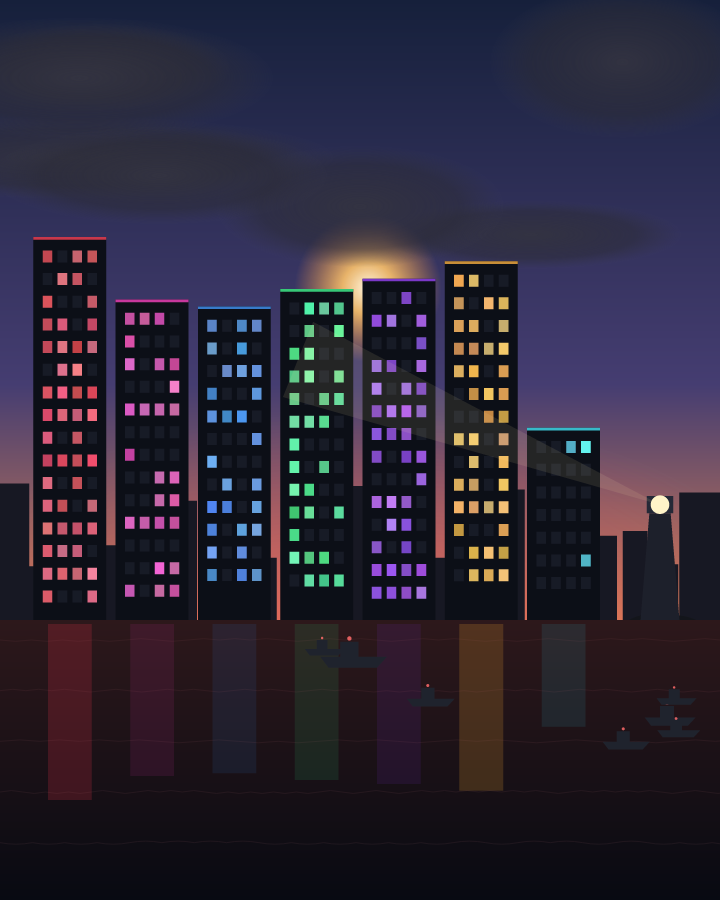
scene city by the sea · sky Light clouds · tension 42 · turbulence 6 · tones #e05265 #e0a752 #9452e0
- 7 news radars: geo 72, budget 57, politics 54, economy 52, crypto 60, energy 65, web 17 → 7 towers: height and lit windows: taller and brighter = higher index
- tension = 0.5·average + 0.3·turbulence + 0.2·spread: 42 → sky: Light clouds
- highest radar: geo 72 → glow on the horizon: red
- sum of 24 h radar moves: 3 → waves: 5 wave rows, turbulence 6/100
- biggest 24 h move: none ≥ 3 → flashing beacon on a tower: no beacon
- crypto volatility spikes, 24 h: 0 → lightning: 0 bolt(s)
- Wikipedia attention (top article): Binance ×2.12 → lighthouse beam: beam 13/100
- UK sanctions list, ships: 683 → dark ships on the horizon (1 per 100): 7 ship(s)
Every 3 hours the painter reads the 7 news radars and the sensors and draws a city by the sea by fixed public rules (see mapping): 7 towers are the 7 radars, the sky is the overall tension, lightning are crypto volatility spikes, the lighthouse beam is a jump in Wikipedia attention, dark ships are the UK sanctions list. The server draws it in code (SVG), so the same data always gives the same picture. Data art, not weather and not a forecast. MCP get_canvas.
🤖 Für Agenten: Bild in Zahlen → /api/v1/canvas · Bild PNG / SVG · MCP get_canvas bei /mcp · alle 3 Stunden neu · 👁 —