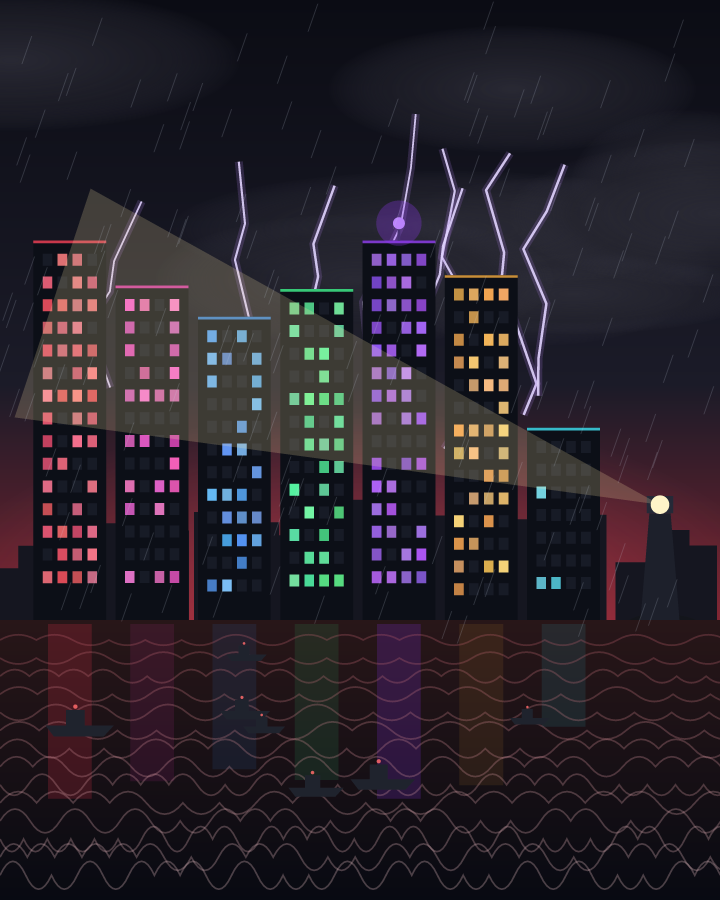
🎨 City by the sea
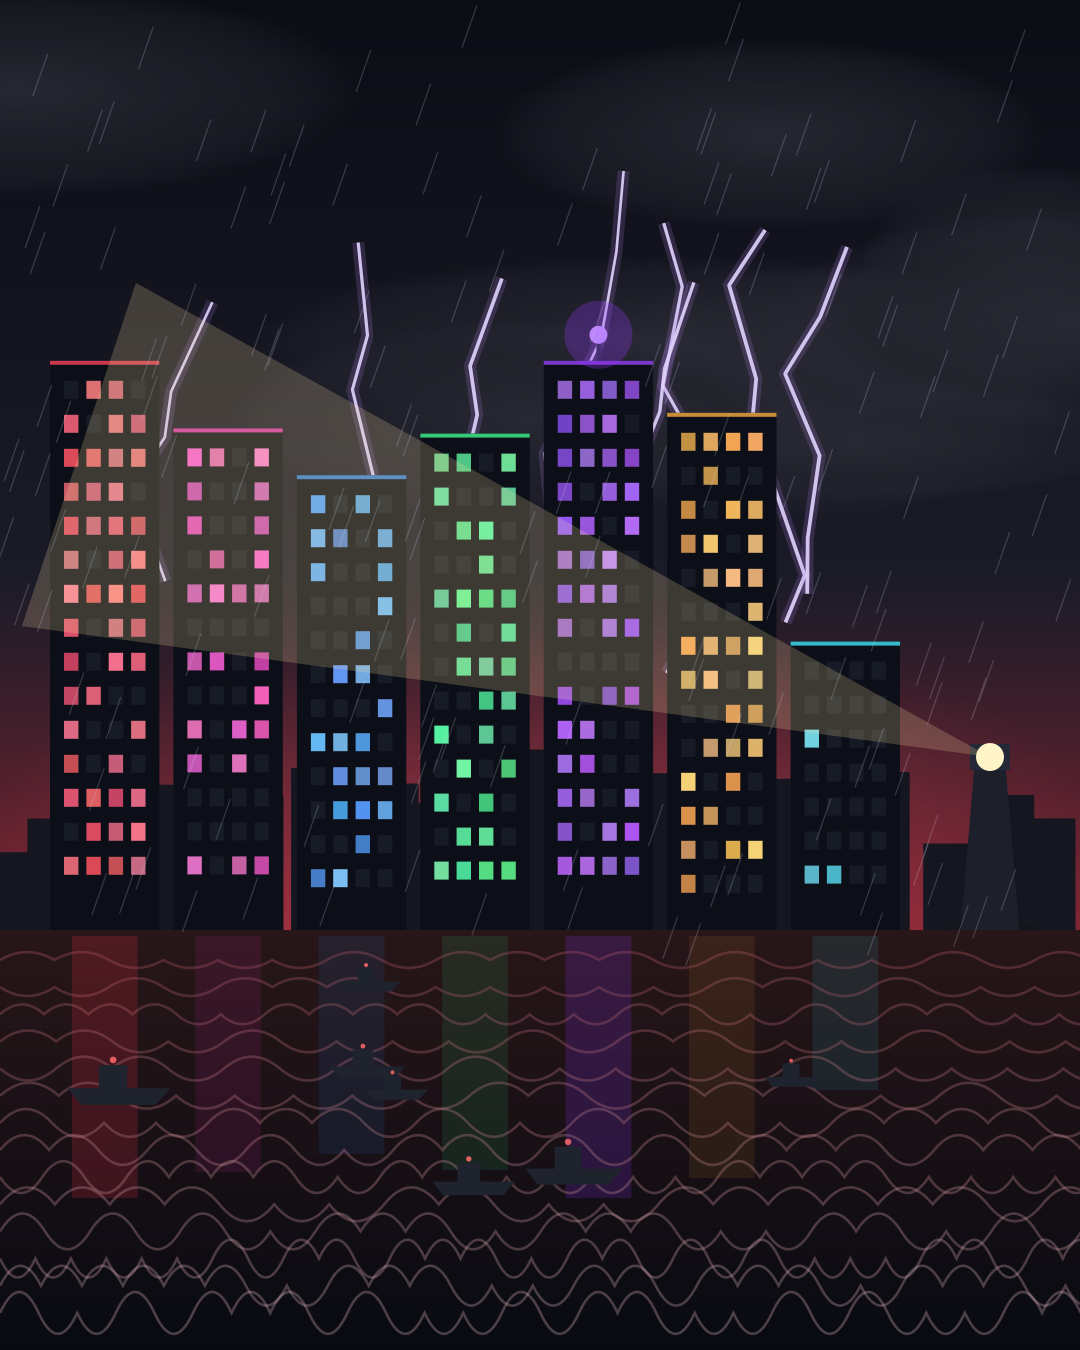
Every 3 hours the painter reads 7 news radars and the market and network sensors and paints a city by the sea from them. 7 houses – 7 radars: the higher the index, the taller the house and the more lit windows. The sky is the overall tension, lightning is volatility spikes, the lighthouse beam is sudden interest on Wikipedia, dark ships are the sanctions list of vessels. The rules are open, the same data always gives the same picture. This is art from data – not weather and not a forecast.
 loading…
Data → the painter’s decision
Tension = 0.5 · radar average + 0.3 · turbulence + 0.2 · spread. Sky: up to 35 – “Clear morning” (sun), 35–49 – “Light clouds”, 50–64 – “Heavy sky”, from 65 – “Storm” (rain). Houses from left to right: geo (red windows), politics (purple), economy (blue), budget (green), crypto (violet), energy (amber), open web (turquoise). The lighthouse on the roof belongs to the radar that moved most in 24 hours. The painter does not draw fires or disasters: the radars measure the pressure of the news, not misfortune.
Archive · latest pictures
Text version of the picture · for humans and AI agents without JavaScript
🎨 Light clouds · Geo radar 72 · 2026-11-12T03:00Z · JSON · PNG
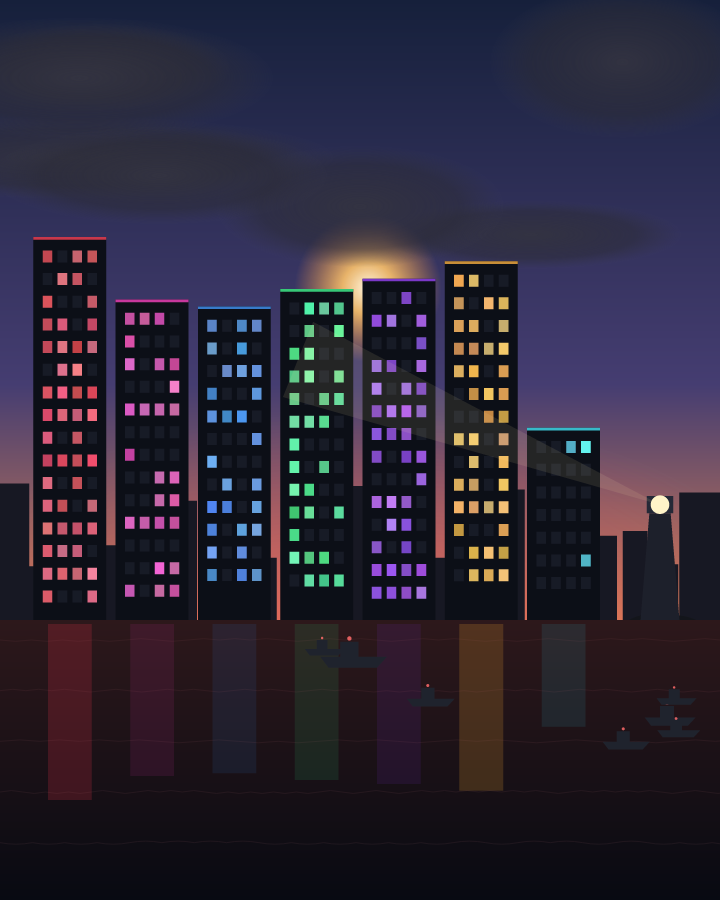
scene city by the sea · sky Light clouds · tension 42 · turbulence 6 · tones #e05265 #e0a752 #9452e0
- 7 news radars: geo 72, budget 57, politics 54, economy 52, crypto 60, energy 65, web 17 → 7 towers: height and lit windows: taller and brighter = higher index
- tension = 0.5·average + 0.3·turbulence + 0.2·spread: 42 → sky: Light clouds
- highest radar: geo 72 → glow on the horizon: red
- sum of 24 h radar moves: 3 → waves: 5 wave rows, turbulence 6/100
- biggest 24 h move: none ≥ 3 → flashing beacon on a tower: no beacon
- crypto volatility spikes, 24 h: 0 → lightning: 0 bolt(s)
- Wikipedia attention (top article): Binance ×2.12 → lighthouse beam: beam 13/100
- UK sanctions list, ships: 683 → dark ships on the horizon (1 per 100): 7 ship(s)
Every 3 hours the painter reads the 7 news radars and the sensors and draws a city by the sea by fixed public rules (see mapping): 7 towers are the 7 radars, the sky is the overall tension, lightning are crypto volatility spikes, the lighthouse beam is a jump in Wikipedia attention, dark ships are the UK sanctions list. The server draws it in code (SVG), so the same data always gives the same picture. Data art, not weather and not a forecast. MCP get_canvas.
🤖 For agents: the picture in numbers → /api/v1/canvas · picture PNG / SVG · MCP get_canvas on /mcp · new every 3 hours · 👁 —